Webshop - Assignment
Purchases distributed on the different age groups, from a webshop
Data
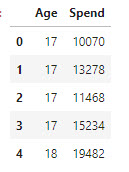
Data are in a Excel file: spend_age.xlsx
Tasks
It is your task to make the following:
Spend pr. group
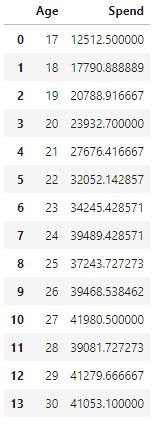
You have to create a “Table” with the mean spend pr. Age group.
Group by Age:
1
2
group_age_spend = df[['Age', 'Spend']].groupby(['Age'], as_index=False).mean().sort_values(by='Age')
group_age_spend
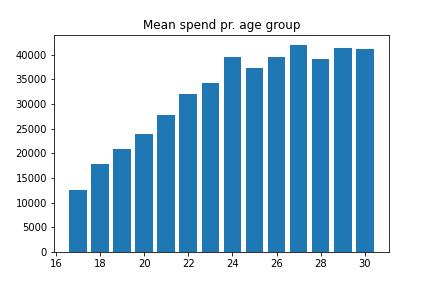
Mean spend pr. age group:
1
2
3
plt.title('Mean spend pr. age group')
plt.bar(x='Age', height='Spend', data=group_age_spend)
plt.savefig("./image/spend_3.jpg")
Data Preprocessing
Now that we have imported the dataset, we will perform data preprocessing.
1
2
X = df.iloc[:,:-1].values  # Independent variable array
y = df.iloc[:,1].values    # Dependent variable vector
Splitting the dataset
1
X_train, X_test, y_train, y_test = train_test_split(X,y,test_size=1/3,random_state=0)
Fitting linear regression model into the training set
1
2
regressor = LinearRegression()
regressor.fit(X_train, y_train) # Produces the linear eqn for the data
Predicting the test set results
1
2
y_pred = regressor.predict(X_test)
y_pred
Show the test “set”
1
y_test
- y_test is the real salary of the test set.
- y_pred are the predicted salaries.
Visualizing the results
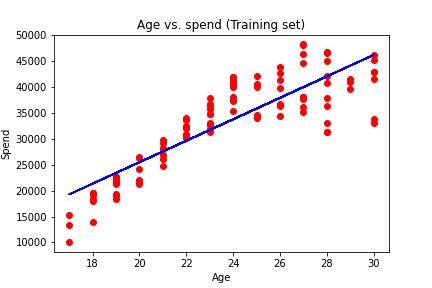
Let’s see what the results of our code will look like when we visualize it.
- Plotting the points (observations)
- Plotting the regression line
Plot for the Training set
1
2
3
4
5
6
7
plt.scatter(X_train, y_train, color='red') # Plotting the observation
plt.plot(X_train, regressor.predict(X_train), color='blue') # Plotting the regression line
plt.title('Age vs. spend (Training set)')
plt.xlabel('Age')
plt.ylabel('Spend')
plt.savefig("./image/spend_4.jpg")
plt.show()
Linear regression
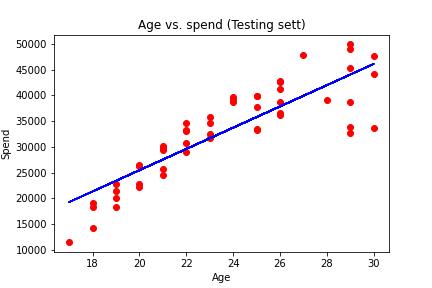
Plot for the Testing set
1
2
3
4
5
6
7
plt.scatter(X_test, y_test, color='red') # Plotting the observation
plt.plot(X_train, regressor.predict(X_train), color='blue') # Plotting the regression line
plt.title('Age vs. spend (Testing sett)')
plt.xlabel('Age')
plt.ylabel('Spend')
plt.savefig("./image/spend_5.jpg")
plt.show()
