Dash app » Azure
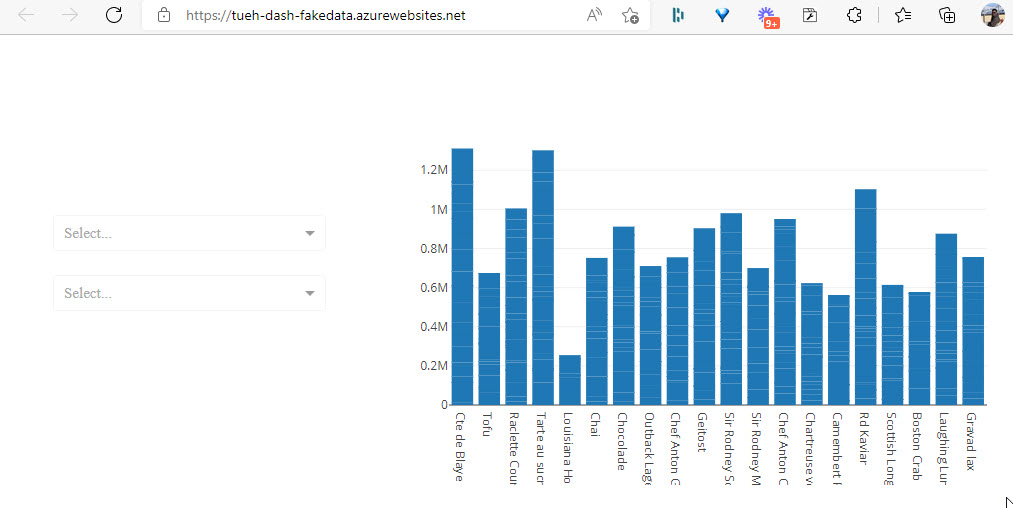
Dash is a powerful software tool for creating dashboards, but if you need to share your dashboards with other?

GitHub
The code and other files for this demo are hostede on GitHub in the repository - TueHellsternKea/kea_dash_fakedata
You can clone this GitHub Repository to you local computer.
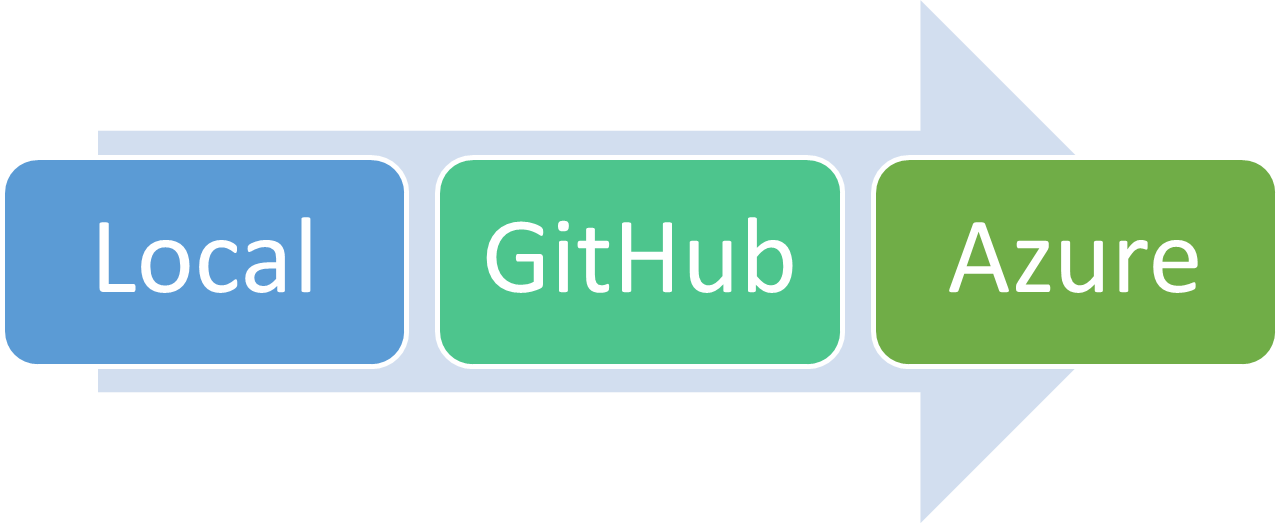
Workflow

- Create the Dash app on your local computer
- Push the app to a GitHub Repository
- Connect Azure App Service with the GitHub Repository
Local
First you have to create a local version of your Dash app.
My Dash app has this files:
- app.py
- datamodel.py
- fake_data.xlsx in the folder data
- requirement.txt
- style.css in the folder assets
app.py
You need a Python file with the name app.py for Azure to deployed the Dash app.
The setup and design of the Dash app is done in this file.
1
2
3
4
5
6
7
8
9
10
11
12
13
14
15
16
17
18
19
20
21
22
23
24
25
26
27
28
29
30
31
32
33
34
35
36
37
38
39
40
41
42
43
44
45
46
47
48
49
50
51
52
53
54
55
56
57
58
59
60
61
62
63
64
65
66
67
68
69
70
71
72
73
74
75
76
77
78
79
80
81
82
83
84
85
86
87
88
89
90
91
92
93
94
95
96
97
98
99
100
101
102
103
104
105
106
107
108
109
110
111
112
113
114
115
116
117
118
# ***************************************
# Imports
# ***************************************
# Dash
import dash
from dash import html
from dash import dcc
from dash.dependencies import Input, Output

# Div.
import pandas as pd
import numpy as np
import calendar

# Plotly
import plotly.express as px
import plotly.graph_objects as go

# ***************************************
# Get data
# ***************************************
import datamodel
order = datamodel.get_data()
df_year = datamodel.get_year()
df_month = datamodel.get_month()

# ***************************************
# Diagram - Employee Sales
# ***************************************
fig_employee = px.bar(order,
    x='emp_name', y='total',
    color='type', text='total', title='Sales by Employee',
    hover_data=[],
    labels={'total':'Total sales', 'emp_name':'Employee', 'type':'Product Type'})
fig_employee.update_traces(texttemplate='%{text:.2s}', textposition='outside')
fig_employee.update_layout(uniformtext_minsize=8, uniformtext_mode='hide', xaxis_tickangle=45)

# ***************************************
# Activate the app
# ***************************************
#app = dash.Dash(__name__)

dash_app = dash.Dash(__name__)
app = dash_app.server

# ***************************************
# Layout
# ***************************************
dash_app.layout = html.Div(
    children=[
        html.Div(className='row',
                children=[
                    html.Div(className='four columns div-user-controls',
                            children=[
                                html.H2('Sales dashboard'),
                                html.P('Select filters from dropdown'),

                    html.Div(children="Month", className="menu-title"),
                            dcc.Dropdown(
                                id='drop_month',
                                options=[{'label':selectmonth, 'value':selectmonth} for selectmonth in df_month['monthnames']],
                            ),
                    html.Div(children="Year", className="menu-title"),
                            dcc.Dropdown(
                                id='drop_year',
                                options=[{'label':selectyear, 'value':selectyear} for selectyear in df_year]
                            ),
                            ]
                    ),
                    html.Div(className='eight columns div-for-charts bg-grey',
                            children=[
                                dcc.Graph(id="sales_employee", figure=fig_employee)
                            ]
                    ),
                ]
            )
        ]
)

# ***************************************
# Callbacks
# ***************************************
# Output er diagrammet
# Input er DropDown
@dash_app.callback(Output('sales_employee', 'figure'),
              [Input('drop_month', 'value')],
              [Input('drop_year', 'value')])

def update_graph(drop_month, drop_year):
    if drop_year:
        if drop_month:
            # Data i både drop_month og drop_year
            order_fig1 = order.loc[(order['orderyear'] == drop_year) & (order['ordermonth'] == drop_month)]
        else:
            # Data i drop_year. men ikke drop_month
            order_fig1 = order.loc[order['orderyear'] == drop_year]
    else:
        if drop_month:
            # Data i drop_month, men ikke drop_year
            order_fig1 = order.loc[order['ordermonth'] == drop_month]
        else:
            # Ingen data - ikke noget valgt
            order_fig1 = order

    return {'data':[go.Bar(
        x = order_fig1['productname'],
        y = order_fig1['total']
            )
        ]
    }

# ***************************************
# Run the app
# ***************************************
if __name__ == '__main__':
    dash_app.run_server(debug=True)
datamodel.py
We need some data, I have create a Excel file fake_data.xlsx. The Excel file is located on GitHub in the data folder.
The Python file datamodel.py are getting the data from the Excel file.
1
2
3
4
5
6
7
8
9
10
11
12
13
14
15
16
17
18
19
20
21
22
23
24
25
26
27
28
29
30
31
32
33
34
35
36
37
38
39
40
41
42
43
44
45
46
47
48
49
50
51
52
53
54
55
56
57
58
59
60
61
62
63
64
65
66
67
68
# Imports
import pandas as pd
import numpy as np
import calendar

# ***************************************
# Import af datamodel
# ***************************************

githubpath = './data/'

# Import from Excel file, 4 different sheets
df_customers = pd.read_excel(githubpath + "fake_data.xlsx", sheet_name="customers")
df_order = pd.read_excel(githubpath + "fake_data.xlsx", sheet_name="order")
df_employee = pd.read_excel(githubpath + "fake_data.xlsx", sheet_name="employee")
df_products = pd.read_excel(githubpath + "fake_data.xlsx", sheet_name="products")


def get_data():
    # Employee name
    df_employee['emp_name'] = df_employee['firstname'] + ' ' + df_employee['lastname']

    # Customers name
    df_customers['cust_name'] = df_customers['first_name'] + ' ' + df_customers['last_name']

    # Data - Add: total, order, year, month
    df_order['total'] = df_order['unitprice'] * df_order['quantity']
    df_order['deliverytime'] = df_order['deliverydate'] - df_order['orderdate']
    df_order['orderyear'] = df_order['orderdate'].dt.strftime("%Y")
    df_order['ordermonth'] = pd.to_datetime(df_order['orderdate'])
    df_order['ordermonth'] = df_order['ordermonth'].dt.month_name()

    # ***************************************
    # Data - Relationer
    # ***************************************
    order = pd.merge(df_order, df_products, on='product_id')
    order = pd.merge(order, df_employee, on='employee_id')
    order = pd.merge(order, df_customers, on='customer_id')

    # Order - Select colomns
    order = order[['order_id',
                'product_id', 'productname', 'type',
                'customer_id', 'cust_name', 'city', 'country',
                'employee_id', 'emp_name',
                'orderdate', 'deliverydate', 'deliverytime', 'orderyear', 'ordermonth',
                'total']]

    # Retuner til app.py
    return order


def get_year():
    # Year - Create a dataframe with years usede in the order dataframe
    df_year = df_order['orderdate'].dt.strftime("%Y").unique()
    df_year.sort()

    return df_year


def get_month():
        # Month - Create a dataframe with month names
    months = []
    for x in range(1, 13):
        months.append(calendar.month_name[x])

    df_month = pd.DataFrame(months, columns=["monthnames"])

    return df_month
requirements.txt
We need an requirements.txt file for Azure.
dash==2.0.0
dash-bootstrap-components==1.0.2
dash-core-components==2.0.0
dash-extensions==0.0.66
dash-html-components==2.0.0
dash-table==5.0.0
numpy==1.21.4
openpyxl==3.0.9
pandas==1.3.5
plotly==5.4.0
You can test the App on your local computer.
GitHub
You need to push the files to a GitHub repository. It is from this repository Azure are getting the data.
Azure
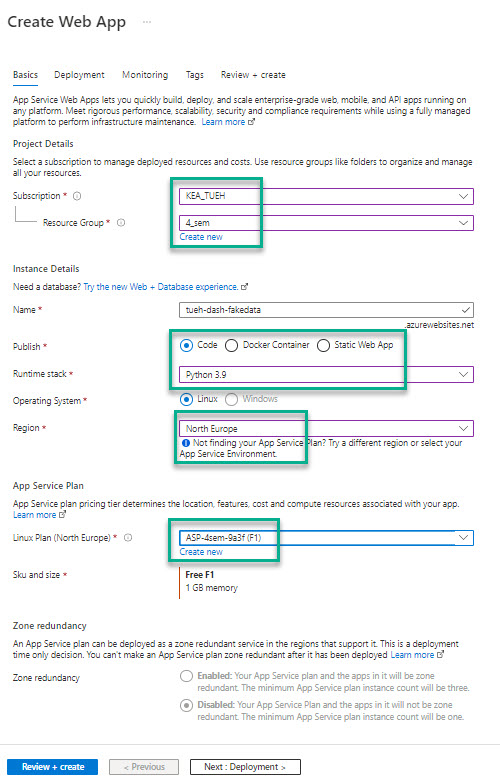
Login to Azure portal.azure.com.

- Select App Services
- Select Create

- Click Review : Create
- Click Create
- Click Go to resource
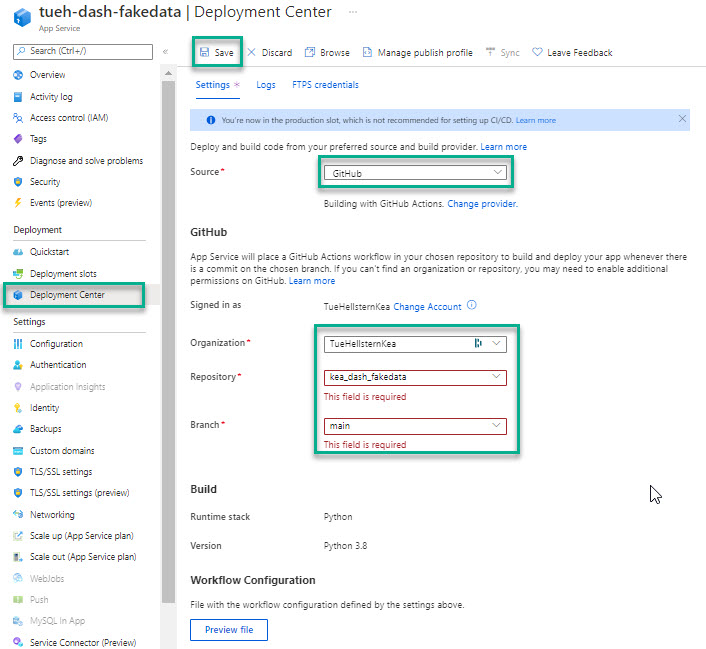
The next step is to deploy the code from your GitHub repository. If you’re not signed into GitHub already, sign in.

Select the Source to - GitHub and fill in your own GitHub information:
- Organization
- Repository
- Branch
Select the Activity Log tab to view the status of the deployment. It takes a to to 10 minutes to build and deploy.
When deployment is complete, select Overview on the left-hand menu to return to the main page for the web app. Select the URL that contains address of the web app.
