Machine Learning in Power BI using PyCaret
How to use Machine Learning in Microsoft Power BI, with the use og PyCaret.
Setting up the Environment
Before we start using PyCaret’s machine learning capabilities in Power BI we have to create a virtual environment and install PyCaret.
Create a virtuel environment see this guide: /Using Jupyter Lab in Virtual Environment
Install modules
You have to install the module:
1
pip install pycaret[full]
You can do a pip list to see all the modules installed.
Set Python Directory in Power BI
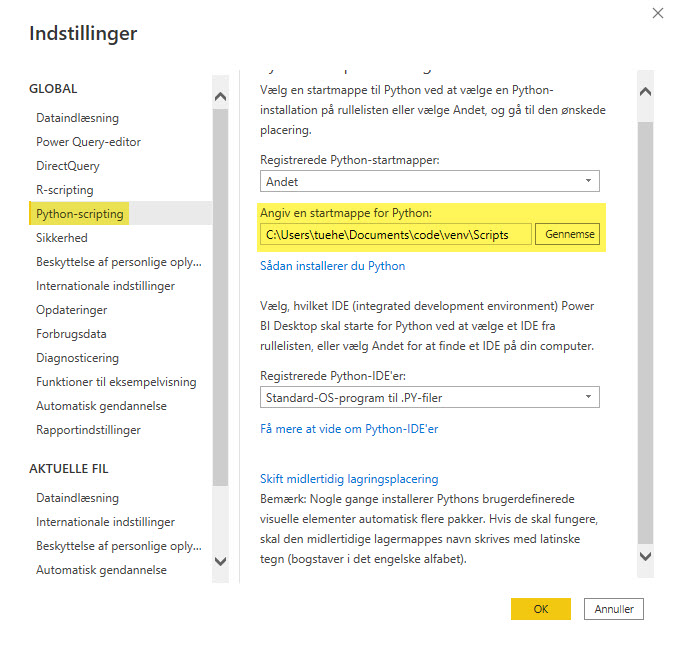
The virtual environment created must be linked with Power BI. This can be done using Global Settings in Power BI Desktop:
File → Options → Global → Python scripting
Use the path from the Virtuel Environment you just created.
Anomaly Detection
Anomaly Detection is a machine learning technique used to identify rare items, events, or observations that differ significantly from most data and raise suspicion.
Typically, abnormal items will turn into some sort of issue, such as bank fraud, a structural defect, medical issues, or error.
There are three ways to implement an anomaly detector:
-
Controlled: Used when there are labels in the dataset that indicate which operations are abnormal and which are normal.
-
Semi-supervised: The idea behind semi-supervised anomaly detection is to train a model on normal data only (without any anomalies). When the trained model is then used on unseen data points, it can predict whether the new data point is normal (based on the distribution of data in the trained model).
-
Unsupervised: Unsupervised as it seems, means no labels and thus no training and test datasets. In unsupervised learning, a model is trained on the entire dataset and assumes that most of the samples are normal. There are several unsupervised anomaly detection algorithms such as the Isolation Forest or Single Class Support Vector Machine. Each has a method of detecting anomalies in the dataset.
We will use 2014–2019 Government Employees Credit Card Processing for the U.S. Department of Education in Delaware. Data is available online on open data platforms Link
Data Upload
The first step is to import the dataset into Power BI Desktop.
You can upload data using a web connector. From Power BI Desktop use: Get Data → Web
https://raw.githubusercontent.com/pycaret/pycaret/master/datasets/delaware_anomaly.csv
Model Training
To train an anomaly detector in Power BI, we will need to run a Python script in the Power Query Editor
Power Query Editor → Transform → Run Python script
Run the code below as a Python script:
1
2
from pycaret.anomaly import *
dataset = get_outliers(dataset, ignore_features=['DEPT_NAME', 'MERCHANT', 'TRANS_DT'])
We ignored some columns in the dataset under the ignore_features parameter.
- DEPT_NAME
- MERCHANT
- TRANS_DT
There are many reasons why you might not want to use certain columns to train a machine learning algorithm.
PyCaret allows you to hide unnecessary columns from a dataset instead of leaving it, as you may need these columns for later analysis.
For example, in this case we don’t want to use the transaction history (TRANS_DT) to train an algorithm and therefore we have stored it as ignore_features.
There are 12 ready-to-use anomaly detection algorithms in PyCaret:
- abod - Angle-base Outlier Detection
- cluster - Clustering-Based Local Outlier
- cof - Connectivity-Based Outlier Factor
- histogram - Histogram-based Outlier Detection
- iforest - Isolation Forest
- knn - k-Nearest Neighbors Detector
- lof - Local Outlier Factor
- svm - One-class SVM detector
- pca - Principal Component Analysis
- mcd - Minimum Covariance Determinant
- sod - Subspace Outlier Detection
- sos - Stochastic Outlier Selection
By default, PyCaret trains a K-Nearest Neighbors Anomaly Detector with a fraction of 5% (ie 5% of the total number of rows in the table are marked as outliers).
Default values can be easily changed:
- You can use the fraction parameter in the get_outliers() function to change the fraction value.
- Use the model parameter in get_outliers() to change the model type.
To train an Isolation Forest detector with a fraction of 0.1, use this code:
1
2
from pycaret.anomaly import *
dataset = get_outliers(dataset, model = 'iforest', fraction = 0.1, ignore_features=['DEPT_NAME', 'MERCHANT', 'TRANS_DT'])

Two new columns are attached to the original table. Label (1 = outlier, 0 = inlier) and Score (data points with high scores are categorized as outlier).
Apply the query to see results in Power BI data set.
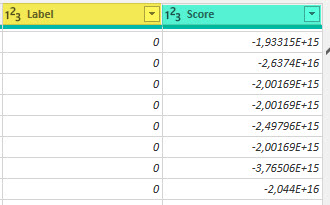
Now you can add som calculations and create a Power BI Dashboard.

Clustering in Power BI
Clustering is a machine learning technique that groups data points with similar characteristics. These groupings are useful for exploring data, identifying patterns and analyzing a subset of data. Some common business use cases for clustering are:
- Customer segmentation for the purpose of marketing
- Customer purchasing behavior analysis for promotions and discounts
- Identifying geo-clusters
We will implementing a clustering analysis in Power BI using PyCaret using the K-Means algorithm which is one of the simplest and most popular unsupervised machine learning algorithms.
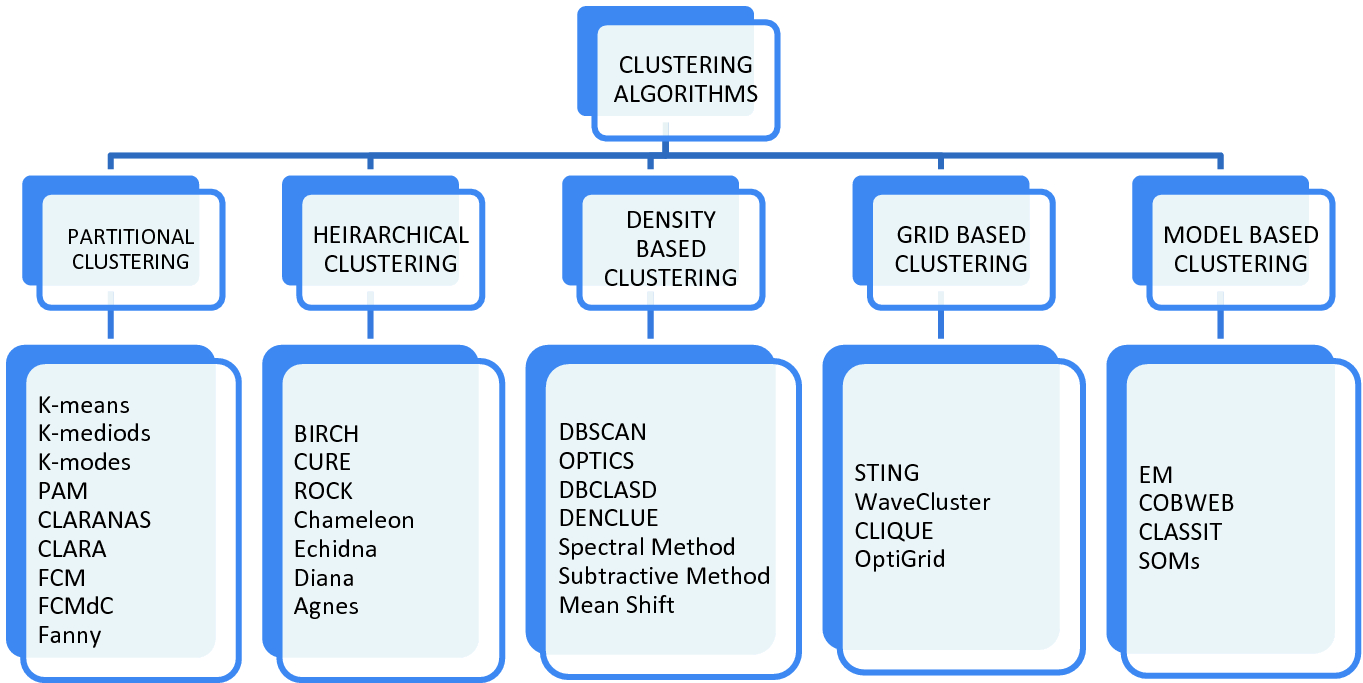
You can read more about K-Means More
Data
We will use the current health expenditure dataset from the World Health Organization’s Global Health Expenditure database
The dataset contains health expenditure as a % of National GDP for over 200 countries from year 2000 through 2017.
Our objective is to find patterns and groups in this data by using a K-Means clustering algorithm.
Import data Power BI
The first step is importing the dataset into Power BI Desktop. You can load the data using a web connector
Power BI Desktop → Get Data → From Web
Link to SCV file: https://github.com/pycaret/powerbi-clustering/blob/master/clustering.csv
Run the following code as a Python script
1
2
from pycaret.clustering import *
dataset = get_clusters(dataset, model='kmodes', num_clusters=6, ignore_features=['Country'])
Model Training
Train a clustering model in Power BI we will have to execute a Python script in Power Query Editor.
Power Query Editor → Transform → Run python script
1
2
from pycaret.clustering import *
dataset = get_clusters(dataset, num_clusters=5, ignore_features=['Country'])
There are over 8 ready-to-use clustering algorithms available in PyCaret.
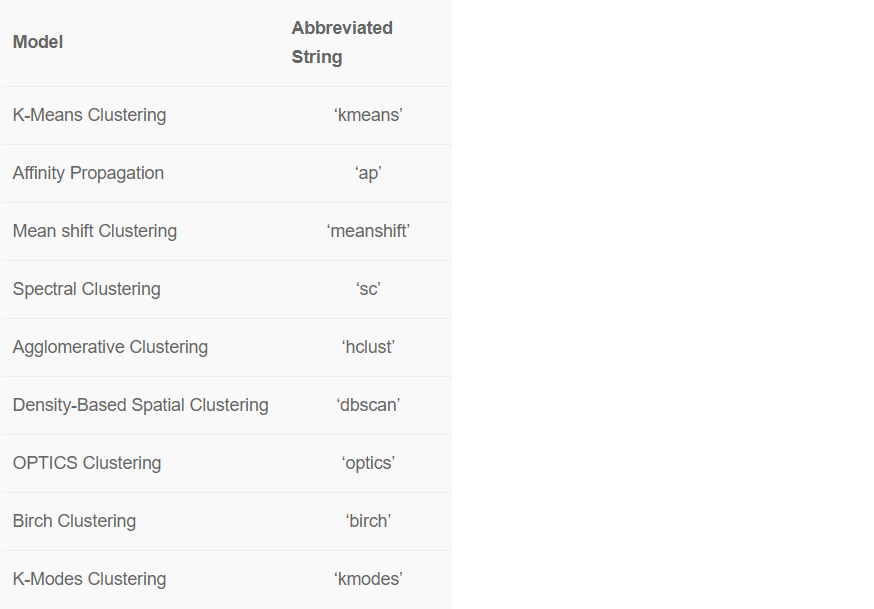
By default, PyCaret trains a K-Means Clustering model with 4 clusters. Default values can be changed easily:
-
To change the model type use the model parameter within get_clusters().
-
To change the cluster number, use the num_clusters parameter.
Example code for K-Modes Clustering with 6 clusters
1
2
from pycaret.clustering import *
dataset = get_clusters(dataset, model='kmodes', num_clusters=6, ignore_features=['Country'])
A new column which contains the cluster Label is attached to the original dataset.
In Power Pivot you need to make some changes to the data:
- Changed Type
- Removed Columns
- Unpivoted Columns
- Renamed Columns

New measurer
Add new measurer:
Average GDP = CALCULATE(AVERAGE(clustering[GDP]))
Dashboard
Once you have cluster labels in Power BI, here’s an example of how you can visualize it in dashboard to generate insights:
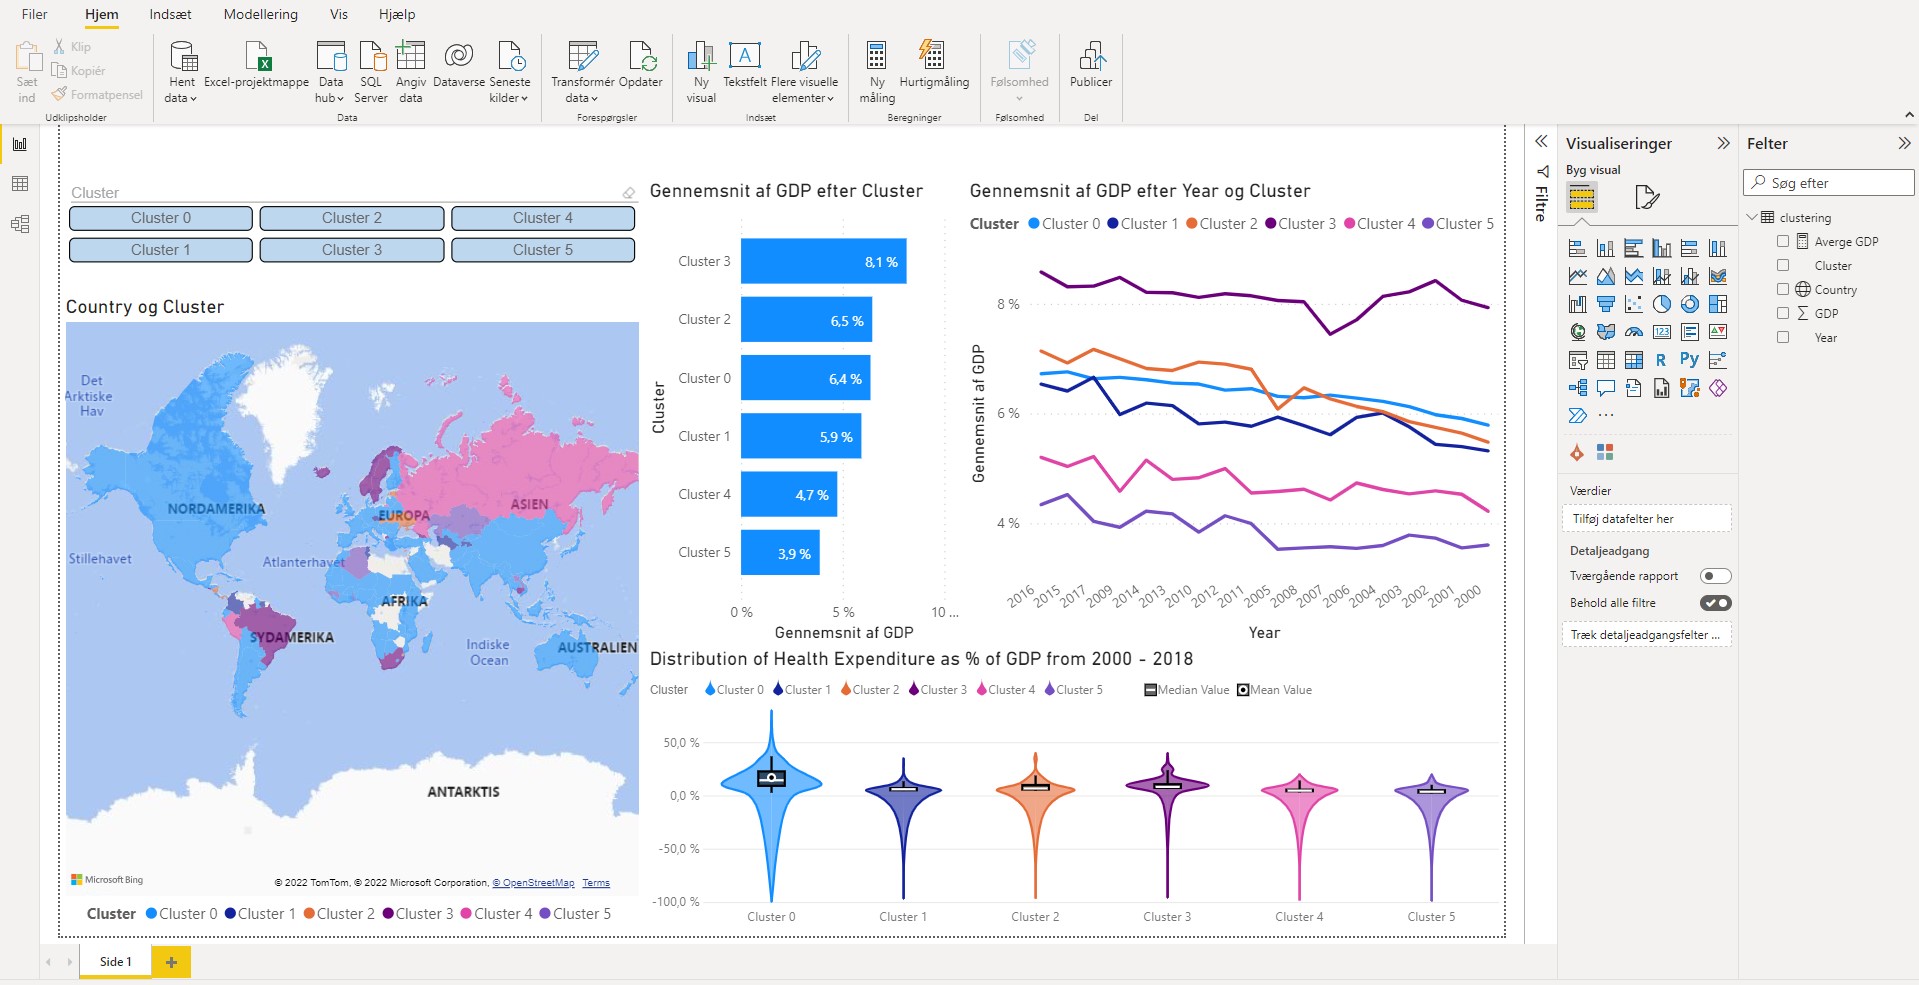
Clustering jewellery
In this demo we will use jewellery.csv file that is available on PyCaret’s github repository.
You can load the data using a web connector.
Power BI Desktop → Get Data → From Web
Link to csv File: https://raw.githubusercontent.com/pycaret/pycaret/master/datasets/jewellery.csv

K-Means Clustering
To train a clustering model we will execute Python script in Power Query Editor
Power Query Editor → Transform → Run python script

Run the following code as a Python script:
1
2
from pycaret.clustering import *
dataset = get_clusters(dataset, model = 'kmodes', num_clusters = 6)
A new column Cluster containing label is attached to the original table.
Apply the query
Power Query Editor → Home → Close & Apply